Guns and Butter: War, Inflation, and Inequality in Lebanon
This paper analyzes the inflationary and distributional effects of recent tax increases in Lebanon within the context of the 2026 war-induced global energy shock. In February 2026, the Lebanese government introduced higher fuel excises and a VAT increase, framing them as socially neutral. The paper challenges this claim by demonstrating the inherently regressive nature of consumption taxes, particularly in a context of severe income inequality and monetary fragmentation. Drawing on inflation theory, the analysis shows how expectations and adaptive pricing amplify the real impact of modest tax changes. Lebanon’s post-2019 hyperinflationary trajectory has created divergent inflation experiences between dollar- and lira-income groups. As a result, uniform tax policies disproportionately affect low-income households, especially those who depend more on income in lira (the hypothetical “lira-earners”). Thus, this paper situates these dynamics within broader historical patterns of war-driven inflation and unequal adjustment. It concludes that Lebanon’s reliance on indirect taxation reflects a deliberate fiscal choice to avoid progressive reforms, thereby reinforcing existing inequalities during periods of crisis.
To cite this paper: Nizar Hariri,"Guns and Butter: War, Inflation, and Inequality in Lebanon", Civil Society Knowledge Centre, Lebanon Support, 2026-06-01 00:00:00. doi:
[ONLINE]: https://civilsociety-centre.org/ar/paper/guns-and-butter-war-inflation-and-inequality-lebanon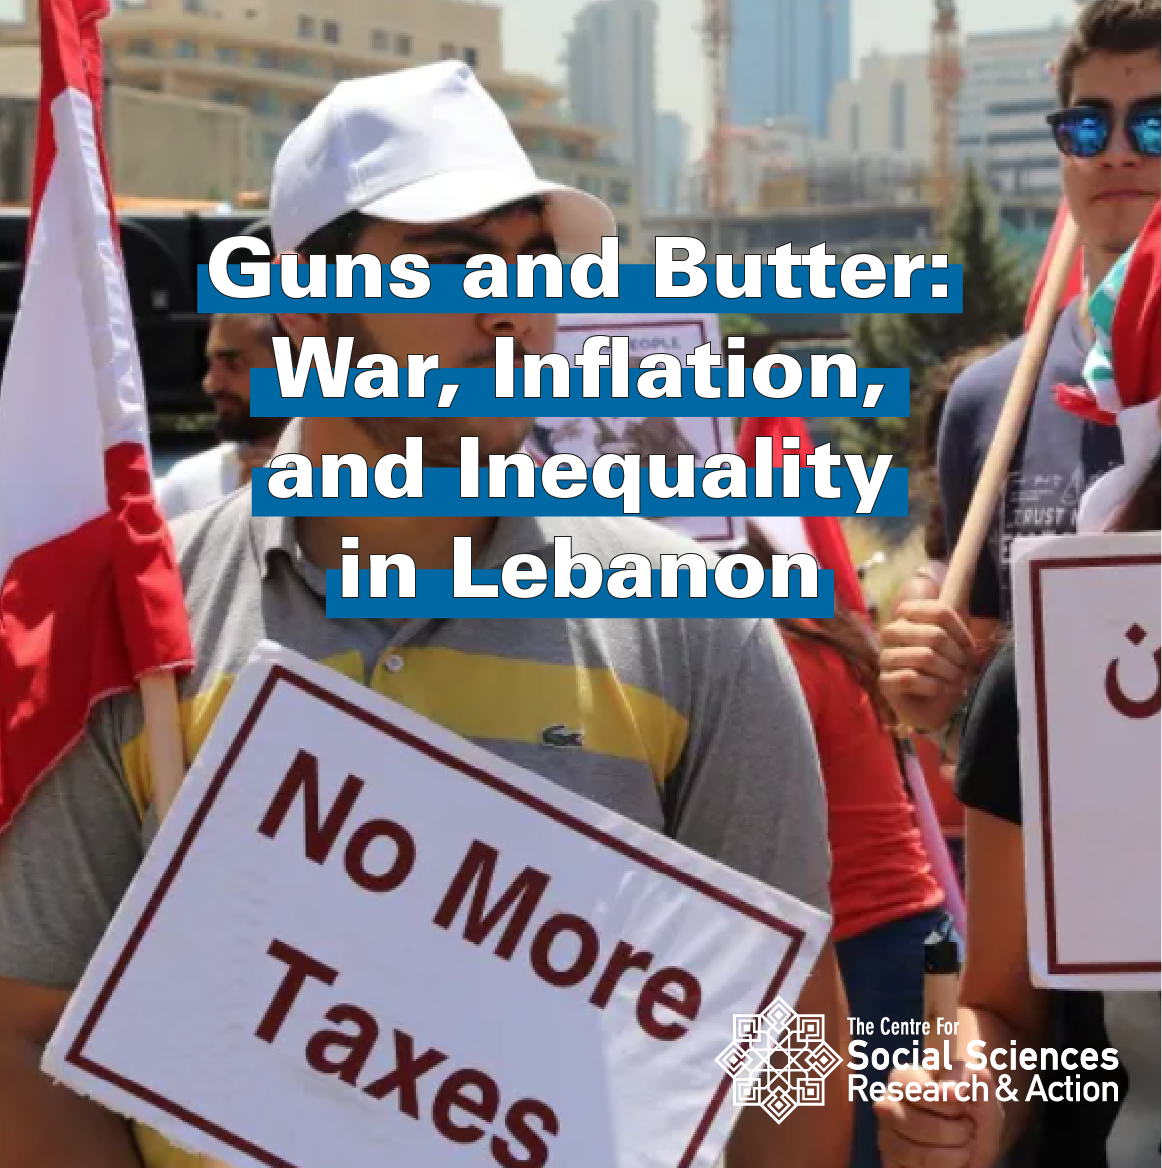
1. Introduction
On 28 February 2026, the United States and Israel launched military strikes on Iran, that were not entirely unexpected. Global oil markets were already anticipating severe disruptions along the Strait of Hormuz, through which roughly 20% of global oil supply transits. As expected, the war triggered an immediate global energy shock. According to the International Energy Agency (IEA), Brent crude briefly approached 120$ per barrel, creating “the largest supply disruption in the history of the global oil market”, forcing many countries to make emergency reserves available to the market[1]. Despite those drastic measures, oil prices were still around 92$ per barrel in mid-March, roughly 20$ higher over the month. Although ceasefire negotiations mediated in Pakistan led to a partial correction in prices, they remained structurally elevated in mid-April, approximately 25% to 35% above their pre-war baseline (around USD 72 per barrel). On a global scale, the recessionist impacts (on growth, unemployment, etc.) are straightforward. As a rule of thumb, the International Monetary Fund (IMF) estimates that a 10% increase in energy prices can raise inflation by approximately 0.4 percentage points while reducing output (between 0.1% and 0.2%) if sustained[2].
It was in this context of mounting geopolitical tension and expected energy price volatility that, two weeks before the war, the Lebanese government introduced an increase in fuel excises, approximately 4 USD ($) per tank (20 litres), alongside a 1% rise in Value Added Tax (VAT). Domestically, the policy was met with immediate resistance. On 17 February, protests erupted across Beirut, with demonstrators denouncing what they described as “impoverishing taxes”. Government officials, however, framed the measures as socially neutral, or even progressive, primarily affecting higher-income groups.
When the Lebanese Prime Minister Nawaf Salam argues that VAT “targets the wealthy,”[3] he is misconstruing basic economics. Economists measure whether a tax is regressive by asking a simple question: what share of someone’s income does it absorb? A tax is regressive if poorer households pay a larger proportion of their income than richer ones, even if richer households (naturally) might pay more in absolute cash terms. A fuel excise, for example, may generate higher cash payments from wealthier drivers simply because they have bigger cars and consume more in total. Yet, for a low-income household that depends on fuel for transport or heating, the tax may represent a much larger fraction of their monthly income.
On 2 March 2026, Israeli attacks on Lebanon caused thousands of casualties, exceeding 2,700 deaths and 8,400 injuries (according to the latest figures from the Ministry of Health[4]), with widespread destruction of infrastructure, including health centres, economic and financial assets, alongside an unprecedented environmental degradation due to the use of unconventional weapons by the Israeli army, such as white phosphorus. At a time when more than one million individuals, representing approximately 20% of the Lebanese population, have been displaced from their towns and villages, discussions of taxation and inflation have understandably receded from immediate public attention. Yet, it is precisely under such conditions, when economic debates are marginalised in the face of more immediate emergencies, that fiscal policies become analytically central.
This paper, therefore, examines the inflationary and regressive effects of recently introduced taxation measures, arguing that their timing and design reveal how the Lebanese state defines the scope of economic intervention in contexts of systemic polycrisis and war, and, more specifically, how it delineates its protective function, whether toward fiscal stability or household welfare.
Confusing absolute burden (how many pounds or dollars you pay) with relative burden (how big that payment is compared to your income) is a classic political maneuver. This rhetorical move is frequently used to obscure the regressive nature of consumption taxes and excises, particularly on essential goods. In static terms, a 1% increase in prices with unchanged nominal income implies a proportional decline in purchasing power across the population. However, in a context such as Lebanon, characterised by high inflation volatility, weak wage indexation, segmented currency regimes, and adaptive pricing behaviour and expectation-driven inflation, such first-order effects significantly underestimate the real impact of price increases. In practice, even marginal increases in indirect taxation can generate disproportionate burdens, with amplified distributional effects.
When analysing inflation, the historical context matters. Higher inflation expectations usually translate into higher real inflation. Thus, inflation is about how we see the past and the future. Periods of elevated inflation expectations tend to translate into higher realised inflation, as price-setting behaviour adjusts accordingly. Inflation is, thus, not only a function of current shocks, but also of how economic agents interpret past trajectories and anticipate future developments. This paper examines the interaction between inflation, fiscal policies, and distributional inequality in Lebanon. It argues that recent tax measures, while modest in nominal terms, contribute to widening disparities in a context already characterised by extreme divergence in purchasing power. By situating these policies within both historical and contemporary inflation dynamics, the analysis shows how low-income households (whether in economic vulnerability, employment precarity, or conditions of displacement) bear a disproportionate share of the adjustment.
The next section starts from the context of “Great Inflations” induced by energy crises, oil shocks, and wars. It demonstrates that their effects are neither globally uniform nor socially homogeneous within countries. The final section turns to Lebanon’s post-2019 trajectory, examining how the country has operated under a regime of monetary fragmentation. It shows how different segments of the population experience distinct inflation trajectories. Households earning in U.S. dollars have been relatively insulated from the most severe price increases, whereas those earning in Lebanese pounds (including civil servants, public sector employees, retirees, and a large share of private sector workers) have faced cumulative inflation rates exceeding several thousand per cent. In such a context, the claim that uniform tax increases are socially neutral becomes inconsistent with the inflationary and distributional dynamics they generate.
2. Oil-war-induced inflation: a scenario repeating since 1973
The escalation of tensions in early 2026 made the inflationary consequences of military conflict in the Gulf highly predictable. Since the first oil crisis in 1973, following the October War[5], inflation has been understood as a central regulatory variable of the global economy. As David Harvey argues, the stagflation crisis of the 1970s, marked by the combination of rising inflation and high unemployment, acted as a catalyst for the global neoliberal agenda, reconfiguring the redistribution of economic burdens along pre-existing lines of power[6]. The second oil shock of 1979, in the context of the Iran-Iraq war, reinforced the understanding that controlling oil prices was at least as important as controlling its supply.
Between the 1960s and 1980s, following decades of fiscal expansions fueled by wars and social spending, a period sometimes referred to as “guns and butter”, economists progressively developed more robust tools to analyse and anticipate inflationary dynamics. Since inflation expectations can become self-fulfilling, they highlighted “the importance of anchoring inflation expectations to stabilise actual inflation, and this lesson has remained highly influential for policymakers to the present day[7]”.
Yet, what appeared as more specific to the 2026 war was the explicit articulation of a global political discourse that directly links the continuation of warfare to its everyday economic cost, while restricting this calculus to actors deemed economically relevant. For a moment, it seemed that the world could be analytically divided between those who have leverage in controlling the costs of inflation, those capable of managing or counteracting them, and those compelled to bear them. The central question, therefore, was to identify where a given country stands within this divide. It is within this asymmetrical landscape that the question of inflation took on broader significance. Hence, discussions of these inflationary effects have been overwhelmingly framed at the global level, with particular attention to their implications for major economies (OECD countries, but also China, Russia and some Arab Gulf countries). When war was analysed from the perspective of the USA and their allies, the discourse was dominated by calculations of cost and efficiency: how much a strike costs, how effective a defence system is, and at what point military action ceases to be economically rational. While every missile and aircraft deployed by major powers was meticulously accounted for, Arab non-oil economies were instead confronted with the marginality of their economic value within the global political economy of warfare. Peripheral economies such as Lebanon or Palestine (and, to a lesser extent, Syria and Jordan) receive comparatively little attention in both global policy discourse and domestic policymaking, despite being exposed to the same energy shocks while simultaneously being subjected to warfare and economic hardship in a more direct manner.
Moreover, in March 2026, the energy crisis and the risks of rapidly ramping inflation became a central element in debates over the necessity of pursuing or halting the conflict. On one hand, Donald Trump was promising the American consumers a short-term return on investment, stating almost on a daily basis that cheap oil would soon be flowing again from the Gulf. On the other hand, in many accounts calling for the end of the war, the anticipated disruption to oil markets and the resulting inflationary pressures often appeared to outweigh the human losses and the material destruction. When observed from the standpoint of Lebanon, these arguments assessing the devastating effects of the war by merely focusing on the heavy economic burdens globally and ignoring the significant human cost in the region do not come as a surprise. Indeed, the Lebanese population has a long experience of abandonment, isolation and self-reliance, even when facing severe economic crises or wars. The increase in VAT and fuel excises came a few days before the war in Iran and Lebanon. While the Lebanese government could claim the timing was a coincidence, it nevertheless has nothing to do with bad luck. In early 2026, while major central banks were refining their inflation projections (and targets), in response to rising energy prices, Lebanese policymakers were simultaneously implementing fiscal measures with direct inflationary effects. As of March 2026, the European Central Bank (ECB) revised its inflation projections for the eurozone upward to approximately 2.6% (exceeding its initial 2% target), explicitly reflecting higher energy prices linked to the war. It emphasised that monetary policy should increasingly focus on forward-looking risk assessments rather than baseline scenarios alone[8]. As stated by the ECB president, the European monetary policy should be attentive to two dimensions: how “wages feed into prices more forcefully when inflation is already elevated” and “how people have experienced inflation in the recent past” since “research shows that lived experiences of inflation can have lasting effects on how people form expectations, with recent salient episodes carrying disproportionate weight”[9].
At the same time, Lebanon entered 2026 under severe fiscal constraints, while preparing to face the economic consequences of regional conflicts and ongoing wars with Israel. The country was still recovering from the previous Israeli aggressions in 2024. Since 2023, the escalation of violence has resulted in more than 4,000 deaths and 16,000 injuries before the ceasefire of 27 November 2024, while an additional 335 people were killed and 973 injured in the year following the ceasefire (up to 27 November 2025)[10].
Nevertheless, the Lebanese state budget for 2026 incorporated very limited provisions to address the long-term social and economic costs of war. Fiscal planning largely proceeded as if these shocks were temporary rather than structural. Moreover, the scale of international support remained disproportionately low: assistance from institutions such as the World Bank (WB) and the IMF was minimal compared to their responses to the war in Ukraine[11]. While this disparity partly reflects Lebanon’s marginal role in global oil and gas markets, it also underscores a more fundamental issue: to what extent is the state’s protective function toward its population being redefined (or progressively eroded) through current fiscal and economic choices?
Before the latest escalation, the Lebanese government had signalled the need to mobilise additional revenue. Budget discussions consistently emphasised two priorities: increasing wages and salaries in the public sector, and expanding the AMAN social assistance program, designed to provide targeted cash transfers to vulnerable households. The increase in VAT and fuel excises was therefore justified as a means to finance wage adjustments for public sector employees, who were among the most severely hit by the financial crisis since 2019, while preserving fiscal space for the social assistance programs. Two weeks before the VAT hike, the National News Agency announced that the “World Bank’s Board of Executive Directors has approved $200 million in funding allocated to strengthening the social safety net”, and that this “funding comes in parallel with the Lebanese Parliament Council’s general budget endorsement, including an actual increase in social spending, particularly the allocation of $55 million for the first time to the "Aman" program”[12]. In this context, anticipating limited inflationary effects from taxation and expecting compensatory transfers to offset welfare losses, both underestimate the cumulative effects of past inflation, as well as the inflationary transmission mechanisms.
Indeed, since 2019, Lebanon has continued to experience elevated inflation, with annual rates remaining in double digits in 2025 (above 14%) following a prolonged period of hyperinflation since 2020 (cf. Table 1 below). In such a context, fiscal measures that increase costs (particularly on energy) are likely to trigger broader price adjustments beyond their initial magnitude, while simultaneously reinforcing inflation expectations. Moreover, in an environment of accelerating prices, beneficiaries of the AMAN program face a progressive erosion of the real value of transfers. The program allocates approximately 25$ per household, with an additional 20$ per member (capped at six members), resulting in total transfers ranging between 45$ and 145$ per household. While these figures may appear adequate in nominal terms, their real value declines rapidly under sustained inflation, raising concerns about the program’s effectiveness beyond its targeting design.
Completely disregarding the recessionary impacts of its inflationary taxes, while turning a blind eye to the alarming signals of the war in the Gulf, the Lebanese government justified those measures as socially fair. In public statements, it was argued that increases in taxes and prices would affect consumers uniformly, regardless of income level. Nevertheless, even slight adjustments in taxation can generate unequal effects when applied within an economy where inflation rates stood among the highest levels recorded globally in recent years.
|
Year |
2017 |
2018 |
2019 |
2020 |
2023 |
2024 |
2025 |
|
CPI |
4.44% |
6.07% |
2.90% |
84.86% |
221.34% |
45.24% |
14.58% |
Far from being a purely technical question, the design of taxation in times of war and crises reflects broader political choices. In the Lebanese case, the reliance on indirect taxation suggests a fiscal strategy that asks households to finance a significant share of the adjustment while leaving the deeper structures of income taxation largely intact. In this light, regressivity is not an abstract or ideological debate. In a country suffering from one of the most severe currency collapses in modern economic history[13], and that has not yet recovered from hyperinflation as shown in Table 1, regressivity becomes particularly consequential. As shown in the next section, any discussion of inflation that ignores this historical trajectory is analytically incomplete, since it will be missing two major intertwined dimensions: the impact of inflation expectations on future realised inflation and the impact of cumulative inflation rates over a long period of hyperinflation.
3. How does inflation affect the rich and the poor in Lebanon?
In Lebanon’s post-2019 economy, the regressivity of VAT or fuel excises could be demonstrated empirically, if not measurable. The distributional effects can be analytically retraced, even in a country where reliable income data are scarce, where identifying precisely who qualifies as “rich” or “poor” would require detailed household surveys, income reporting, and careful estimation of consumption patterns and demand elasticities.
Under normal conditions, measuring tax incidence requires complex modelling: one must estimate household incomes, determine how much of each income group’s budget is spent on VAT-liable goods, assess how price changes feed into inflation, and then calculate the effect on real purchasing power. But Lebanon is not operating under normal inflation conditions. After the 2019 financial collapse, the economy started operating under hyperinflation in the Lebanese pound (LBP or lira) segment of the economy and lower inflation rates in the US dollar segment. In such a context, a 1% VAT increase becomes an extreme case study in regressivity because it is applied on top of two radically different cumulative inflation paths, thus illustrating distributional effects with a clarity that would have been impossible in a stable economy.
We hereby construct two hypothetical but analytically grounded groups, following the methodology of the WB that differentiated the impact of devaluation in Lebanon on those who earn their income in US dollars (USD) and those who earn it in LBP[14]. The first group consists of hypothetical “USD earners,” defined as individuals whose income has been fully denominated in U.S. dollars since 2019 and who have therefore been exposed primarily to dollar-denominated price movements. The second group consists of hypothetical “LBP earners,” defined as individuals whose income has remained denominated in Lebanese pounds and who have therefore been fully exposed to the cumulative inflation measured in the domestic currency. By using the Consumer Price Index (CPI) of the Central Administration of Statistics (CAS), we can rigorously demonstrate how a uniform 1% VAT increase produces unequal burdens once it is situated within Lebanon’s post-2019 monetary collapse.
Lebanon’s inflation trajectory between 2017 and February 2026 can be divided into three distinct cycles: a period of low-growth macroeconomic stagnation with moderate inflation; a period of financial collapse and hyperinflation following October 2019; and a subsequent phase of disinflation under conditions of de facto exchange-rate stabilisation, social degradation, and then war-related disruption.
|
Period |
CPI start |
CPI end |
Cumulative inflation |
Avg. monthly inflation |
Median monthly inflation |
Avg. y/y inflation |
Median y/y inflation |
|
Pre-crisis inflation: Jan 2017-Sep 2019 |
98.47 |
108.85 |
10.55% |
0.29% |
0.23% |
4.53% |
4.62% |
|
Pre-war inflation: Oct 2019-Sep 2023 |
110.34 |
4,971.28 |
4405.59% |
8.51% |
7.36% |
147.61% |
146.70% |
|
Wartime inflation: Oct 2023-Feb 2026 |
5,827.35 |
8,068.09 |
38.45% |
1.73% |
1.06% |
51.53% |
16.09% |
The official monthly CPI series produced by CAS shows a clear structural break after late 2019. Read together with World Bank and Lebanon-focused policy research, the series suggests that inflation in Lebanon was not a simple monetary phenomenon, but the outcome of a wider crisis configuration combining a sudden stop in capital inflows, exchange-rate collapse, banking paralysis, subsidy removal, import dependence, and eventually wartime destruction[15].
3.1. Before 2019: A Unified monetary framework
In the pre-crisis context, there was no structural divide between lira and dollar earners. Lebanon operated under a fixed exchange rate regime: 1,500 Lebanese pounds per U.S. dollar. Under this peg, income denominated in lira and income denominated in dollars were effectively equivalent in purchasing power.
Consider two individuals. One earns 1,000 USD per month. The other earns 1,500,000 LBP per month. At the fixed rate, 1,500,000 LBP ÷ 1,500 equals 1,000 USD. Their purchasing power was the same. Prices, wages, and taxes operated within a single, coherent monetary system.
As such, inflation remained moderate despite near-stagnant growth. As shown in Table 2, CAS-based calculations yield an average year-on-year inflation rate of 4.53% between January 2017 and September 2019, with an average monthly inflation rate of only 0.29%. Surely, between 2017 and 2019, growth rates were close to zero, and macroeconomic imbalances were already deep, but the exchange-rate regime still acted as a nominal anchor, so inflation remained positive yet contained. This first phase can therefore be described as one of stagnation without generalised price disorder.
Moreover, between January 2017 and September 2019, food inflation remained modest at 7.34% cumulative, transportation at 9.27%, and the energy subcomponent at 9.88%. In other words, the main CPI components moved, but none detached violently from the aggregate index. Thus, it is worth noting that before late 2019, Lebanon was already economically fragile, but not yet in a regime of explosive and self-reinforcing inflation.
In that context, a VAT increase would have had broadly similar distributional effects across currency groups. Under the hypothesis of prices and wages moving within the same exchange rate regime, the proportional burden of a consumption tax would have been primarily a function of income level, not currency denomination.
Thus, the pre-2019 system did not structurally divide households and non-financial agents into separate monetary worlds, at least insofar as they were not operating within financial markets (where, admittedly, interest rates on USD and LBP instruments did differ). Accordingly, the remainder of this paper focuses on income derived from non-financial, non-monetary activities (such as wages, the sale of goods, and the provision of services etc.) commonly referred to as the “real economy,” as opposed to financial or purely monetary transactions.
3.2. The aftermath of the 2019 devaluations: Two disconnected economies
The breakdown of the exchange rate transformed Lebanon into a dual economy. The lira depreciated from 1,500 per dollar in 2019 to around 89,000 today. Prices of goods, especially imported goods, adjusted rapidly to the parallel market rate. Wages in lira did not.
This divergence created two structurally distinct groups. On one side were lira earners: primarily public sector employees, retirees, and many fixed-wage private sector workers whose salaries were denominated in LBP. On the other side were dollar earners: corporations, importers, professionals, and many self-employed actors or liberal professions who could denominate transactions in USD or adjust prices dynamically to exchange rate movements.
In the prewar crisis time, the CPI rose from 110.34 in October 2019 to 4,971.28 in September 2023, implying cumulative inflation of more than 4,400%. Average monthly inflation reaches 8.51%, and average year-on-year inflation reaches 147.61% (cf. Table 2 above). The disaggregated inflation patterns (cf. Table 3 below) reveals a highly uneven distribution of price increases across consumption categories.
|
Component |
CPI weight |
Cumulative inflation |
Avg. monthly inflation |
Avg. y/y inflation |
|
Food and non-alcoholic beverages |
20 |
20480.58% |
12.43% |
267.72% |
|
Transportation |
13.1 |
10418.68% |
10.84% |
236.91% |
|
Water, electricity, gas and other fuels |
11.8 |
3609.58% |
8.48% |
166.82% |
|
Health |
7.7 |
4299.07% |
9.80% |
176.67% |
|
Education |
6.6 |
342.96% |
4.98% |
60.62% |
|
Communication |
4.5 |
1734.41% |
7.79% |
137.62% |
Notably, food and non-alcoholic beverages, accounting for the largest weight in the CPI (20%), experienced the highest cumulative inflation, with double-digit monthly inflation rates. When these dynamics are examined in light of findings from household surveys from that period[16], their distributional implications become particularly stark. Research showed that low-income households in Lebanon allocated the majority of their income in this period for three essential categories: food, transportation, and energy. In many cases, expenditures on these items alone were sufficient to absorb the entirety of household income, forcing families to rely on borrowing money or depleting their savings in order to meet basic needs. While inflation rates for other categories, such as education and health, remained comparatively lower, these expenditures increasingly became unaffordable, effectively transforming services such as education and, in many cases, healthcare into de facto luxury goods, accessible only to a shrinking segment of the population. In this context, hyperinflation was not experienced uniformly across the population but rather disproportionately affected the most vulnerable groups.
The WB’s analysis strongly reinforces this reading. Its 2024 Poverty and Equity Assessment states that the Lebanese pound had lost 98% of its pre-crisis value by December 2023, that imports represented about 60% of the consumption basket, and that inflation surged from an annual average of around 3% in 2011–2018 to 85% in 2019, 155% in 2020, and 221% in 2023. The same report emphasises that food inflation became even more dramatic than headline inflation and that the withdrawal of subsidies on medication, fuel, and wheat intensified cost pressures in healthcare and transport[17]. As indicated in Table 3, data from the CAS between October 2019 and September 2023 show that food prices rose cumulatively by 20,480.6%, transportation by 10,418.7%, the energy subcomponent by 3,609.6%, and health by 4,299.1%. The crisis was thus not only one of general inflation but of a socially punitive inflation structure, because the fastest-rising categories were also essential ones for the lower-income groups.
What also increases the inequality of those inflationary paths is that many households, during this same period, increasingly shifted into a dollarized cash economy in which access to foreign-currency income became a key buffer against inflation. Consequently, people paid partially or fully in foreign currency were relatively shielded from the collapse in purchasing power, whereas those reliant on lira earnings were not.
At that same time, many firms declared revenues in lira at the outdated official rates, while at the same time, many were benefiting from subsidised exchange rates far below the parallel rate (mainly importers of fuel, medications and wheat). Tax liabilities were therefore calculated on nominal values that understated real income. In practice, this functioned as a partial fiscal holiday for segments of the USD economy. At the same time, lira earners continued paying VAT and other consumption taxes on goods whose prices were increasingly indexed to the parallel rate.
To understand the fiscal asymmetry that emerged, let us return to the simple pre-2019 example (of one USD-earner with a fixed wage of 1000 USD and one LBP-earner with a fixed wage of 1.5 million LBP) and let us assume a flat income tax of 10%. Before 2019, both workers used to contribute equally in real terms (100 USD or 150,000 LPB, which were equal at the peg). Now fast forward to the post-devaluation period. Consider a professional (or a firm) earning the equivalent of 1,000 USD per month but declaring income in LBP at an official rate that understates its real value. If that income is converted for tax purposes at a rate far below the parallel rate, the effective tax burden shrinks in real terms. If income equivalent to 1,000 USD is declared as 1,500,000 LBP (using the old peg or another administratively set rate), then the agent paying 150,000 LBP at a market rate of 89,000, for instance, would be paying around 1.68 USD to the State. In this case, the effective tax rate in real dollar terms becomes 0.168% instead of the hypothetical 10% on income taxes. This is what can be described as a de facto fiscal holiday for segments of the USD economy during the early crisis years.
While the USD earner now earns about 59 times more than the LBP earner in real terms, the latter continues to pay the same proportion of income taxes (10%). This simple income tax example demonstrates how the regressivity and the fiscal burden varied during the fluctuating periods of the devaluation. It also reveals how an exchange rate collapse can silently redistribute the effective tax burden across currency groups. We can derive from it a general rule: when income is effectively earned (and relatively stabilised) in dollars but taxed (always in lira) at administratively distorted rates, the real tax burden shrinks. When income remains fixed in lira while prices adjust to the parallel market rate, the burden rises in real terms.
The same logic does not stop at income taxation. It applies equally (and often more harshly) to taxation targeting consumers (such as VAT) and to excises (such as on fuel). When prices are indexed to the parallel exchange rates, but wages are not, a uniform tax rate generates unequal real burdens. Surely, the tax system did not formally differentiate between USD and LBP earners, but the exchange rate collapse did that implicitly.
In the following section, we extend this demonstration from income taxation to VAT and excise taxes in times of war, showing how a seemingly small increase (such as the current 1% rise in VAT) compounds inequality when applied to two economies that have experienced radically different inflation paths.
3.3. Differential impact during wartime (Oct. 2023-Today): VAT, fuel, and regressivity
Even prior to the 2023 war, hyperinflation in Lebanon was not experienced uniformly. It created a sharp cleavage between households with access to dollars, remittances, or foreign-currency-linked earnings, and households whose wages remained denominated in Lebanese pounds. The World Bank’s 2024 Lebanon Economic Monitor summarises the divergence succinctly:
“Comparing differences in purchasing power between a hypothetical dollar earner and an LBP earner, the report finds dollar earner, whose income has been fully denominated in USD since 2019 would have experienced a cumulative 4.9 per cent decrease in purchasing power from September 2019 to 2024… Despite these fluctuations, this overall decline is dramatically lower than the staggering 5,970.7 per cent cumulative inflation faced by an LBP earner over the same period[18].”
Cumulative inflation means the total price increase over several years combined. An inflation rate of 5,970.7 per cent means prices were multiplied by approximately 60.7 times. By contrast, 4.9% cumulative inflation means prices increased in a relatively marginal or negligible manner for the USD earners.
Since 2024, the Lebanese economy has entered a phase of 2-digit inflation rates. Thus, this third period could best be described as disinflation at a very high price level, rather than price stability. Cumulative inflation from October 2023 to February 2026 is still 38.45%, as shown in Table 2, while average monthly inflation falls to 1.73%. The mean year-on-year rate remains elevated at 51.53%, but the median year-on-year rate is much lower at 16.09%, indicating that the phase is shaped by strong base effects from the hyperinflationary spike of 2023.
|
Component |
Food and non-alcoholic beverages |
Transportation |
Water, electricity, gas and other fuels |
Health |
Education |
Communication |
|
Cumulative inflation |
53.38% |
16.09% |
5.67% |
24.54% |
78.42% |
26.65% |
|
Avg. monthly inflation |
1.58% |
0.64% |
0.59% |
0.79% |
22.33% |
0.94% |
|
Avg. y/y inflation |
51.28% |
25.75% |
28.94% |
43.31% |
264.15% |
29.39% |
The fact that cumulative inflation between October 2023 and February 2026 remains relatively moderate (for instance, 5.67% for water, electricity, gas and other fuels), while average year-on-year inflation remains significantly higher (28.94% for the same component), reflects the combined effect of base effects and inflation expectations in a post-crisis environment. In the case of water, electricity, gas, and other fuels, the relatively low cumulative increase (a cumulative inflation of 5.67% between October 2023 and February 2026, as shown in Table 4) suggests that prices had entered a phase of relative stabilisation following the removal of subsidies and the adjustment to a higher cost structure. In other words, the sector had already absorbed the bulk of the shock during the hyperinflationary phase (2019–2023), and prices were, for a time, aligning with a new equilibrium consistent with exchange rate conditions and import costs, despite the war context (2023-2026). For the other components of the CPI, the persistence of relatively high year-on-year inflation indicates that this stabilisation remained fragile and incomplete. In an economy such as Lebanon’s, price dynamics are strongly influenced by inflation expectations rather than by current cost conditions alone. Economic agents, anticipating further currency depreciation, supply disruptions, or policy reversals, may adjust prices preemptively. This forward-looking behaviour sustains inflation even when underlying costs are temporarily stable.
This is particularly relevant in the context of the war. Between October 2023 and February 2026, some components (especially energy-related ones, transportation, and health) appear to have reached a temporary plateau, reflecting both the exhaustion of previous price adjustments and a short-lived stabilisation of the exchange rate.
However, subsequent policy signals and market responses, particularly those associated with the recent VAT hikes, fuel excise and renewed fiscal pressures or changes in pricing mechanisms, will surely contribute to reactivating inflationary expectations. This instability is not merely a residual effect of past shocks. It is rather a reflection of ongoing uncertainty regarding the trajectory of the economy and the credibility of policy interventions.
Most importantly, a 1% increase in the prices of basic goods and services does not affect all social groups in the same way. Its impact differs between rich and poor households, between civil servants and liberal professions, and between the active population and retirees. In times of war and displacement, it also affects displaced and non-displaced populations differently. These differential effects depend on the extent to which each group has already been exposed to the cumulative impact of past inflation on its purchasing power. To illustrate this unequal impact, we return one last time to the distinction between two hypothetical groups: USD earners and lira earners.
Now consider the minimum wage. Before 2019, it stood at 675,000 LBP (roughly 450 USD at the peg). By 2025, it reached about 28 million LBP, equivalent to roughly 315-320 USD at the prevailing exchange rate.
Nominally, the minimum wage is multiplied by around 40. But prices multiplied by about 60.7 for the LBP earners. Real purchasing power, therefore, equals 40 divided by 60.7, or approximately 0.66 according to the WB calculation. Even after the large nominal adjustment, a minimum wage earner retains only about two-thirds of their pre-crisis purchasing power, implying a loss of roughly one-third to forty per cent. To fully restore 2019 purchasing power, wages would need to rise by a factor of 60.7 rather than 40 (i.e. an additional increase of roughly 40% beyond current levels).
This, however, is an optimistic benchmark, given that the minimum wage primarily applies to private sector employees and many public sector wages remain below that level. In numerous cases, wage increases were distributed as temporary “assistance” rather than incorporated into the official salary base (asl al-rateb), meaning they do not affect pensions or end-of-service indemnities. The structural divergence between lira earners and dollar earners, therefore, persists, and it will be perpetuated through pension schemes and other social benefits.
For lira earners, cumulative inflation was 5,970.7 per cent according to the WB; this corresponds to a price factor of 60.707. Applying the VAT shock multiplies this by 1.01, producing 61.314. Cumulative inflation therefore rises from 5,970.7% to approximately 6,031.4%. The additional 1% VAT adds roughly 60 percentage points to cumulative inflation.
For dollar earners, cumulative inflation was 4.9 per cent, corresponding to a factor of 1.049. Multiplying by 1.01 yields 1.059. Cumulative inflation rises to about 5.95%, an addition of roughly one percentage point.
In conclusion, for the lira-earners, the rise of 1% of VAT adds about 60.7 percentage points to cumulative inflation. For USD earners, the VAT adds about 1.05 percentage points.
The same analytical reasoning can be extended to fuel price increases and excise taxes. since the underlying mechanism is identical: when income trajectories and cumulative inflation histories diverge so sharply across groups, identical percentage adjustments do not generate identical economic burdens. The reader can readily apply the same framework to assess those effects. Numerically similar proportional declines mask structurally unequal baselines.
More generally, a 1% increase in VAT applied after hyperinflation compounds inequality because it operates within a society already divided by currency denomination, pricing power, and incomplete wage adjustment.
4. Conclusion
This paper aimed to reintroduce the question of inequality into the analysis of war-induced inflation in Lebanon, a country both among the most affected by the conflict and among the least central to the global economic system. Lebanon offers a particularly revealing case, not least because it has experienced one of the most severe episodes of hyperinflation worldwide since 2019. On the one hand, it highlights how war produces differentiated regimes of physical protection. Lebanon faces direct exposure to warfare in the absence of international protection (without air defence systems and without external military backing from the United States or Europe, unlike some neighbouring Arab countries), leaving the population largely reliant on evacuation orders issued by Israeli aviation that is bombing large swathes of land and persistently violating the protected status of cemeteries, hospitals, or UNESCO-listed heritage sites[19]. On the other hand, it illustrates how war generates differentiated economic outcomes. While neighbouring populations were partially shielded through coordinated monetary and fiscal responses, residents in Lebanon have largely borne the shock. This external marginalisation has been reinforced by domestic economic policies that have severely limited the scope for state-led emergency intervention.
It is noteworthy here to point out that VAT is not simply a percentage applied at the cash register, and further research in Lebanon is needed to understand how the VAT is collected along the entire value chain, reported from one vendor to another, with input credits deducted at each stage. In theory, this mechanism ensures neutrality: firms collect VAT on behalf of the state, deduct the VAT they have paid on inputs, and remit the difference. The final burden falls on the consumer. In practice, especially in a fragmented and partially informal economy, the system does not operate so cleanly. Exemptions, compliance gaps, delayed refunds, underreporting, and sector-specific arrangements mean that VAT collection is uneven. In such contexts, consumers may bear higher prices while the state does not necessarily capture the full intended revenue. Firms with pricing power can widen margins under the cover of a tax increase, particularly when price transparency is weak and inflation expectations are already elevated. In the hyperinflationary environment of Lebanon, the macroeconomic impact of a 1% VAT increase is open to debate. One may argue about its effect on aggregate demand, inflation dynamics, or fiscal consolidation. But one conclusion is far less ambiguous: when incomes have diverged sharply (as they have between lira earners and dollar earners), any additional marginal sacrifice will be more uneven for the lower-income groups.
When policymakers choose to rely primarily on consumption taxes, they are generally aware that they are making a distributive choice and that such measures entail a transfer of resources among different social groups. By relying on uniform consumption taxes, they avoid addressing the politically sensitive question of taxing profits, large fortunes, financial rents, and high-income actors. This choice is not accidental, and the message it conveys has been repeatedly heard in recent years: the architecture of unequal income taxation should remain largely untouched, even as the country faces one of the worst economic crises in the world, and destructive wars that, for the second time in three years, are displacing more than 20% of the population. It reflects a fiscal orientation that prioritises indirect, broadly applied taxation precisely because it allows the state to sidestep (implicitly yet persistently) the structural question of progressivity within the Lebanese tax system.
List of references
Binder, Carola, and Rupal Kamdar. “Expected and Realized Inflation in Historical Perspective.” Journal of Economic Perspectives 36 (3): 131–56, 2022.
ECB, Economic Bulletin, Issue 2 / 2026 – Economic, financial and monetary developments Overview, March 2026.
Georgieva Kristalina (IMF Managing Director). “Future of the Global Economy amid a Fluid International Economic and Monetary Order”, Symposium in Tokyo, at Japan's Ministry of Finance's, 9 March, 2026
Hariri, Nizar. “When the World Bank Assesses the War in Ukraine and the Conflicts in Palestine and Lebanon”, The Centre for Social Sciences Research and Action (CeSSRA), 2025.
Hariri, Nizar. “Unprotected. Survey Report on The Challenges of The Current Social Protection System in Lebanon Amidst the Crisis.” The Centre for Social Sciences Research and Action (CeSSRA), 2023.
Harvey, David. A brief history of neoliberalism. Oxford University Press, 2007.
International Energy Agency. “Oil Market Report”, March, 2026.
Jamali, Ibrahim. “Lebanon’s Economic Crisis: A Stabilization Plan and an IMF Program Report on the Second Webinar Series”, Issam Fares Institute, American University of Beirut, 2022.
Lagarde Christine (President of the ECB). “The ECB and Its Watchers”, conference organised by the Institute for Monetary and Financial Stability at Goethe University Frankfurt, 25 March 2026.
World Bank. “Lebanon sinking (to the top 3)”, 2021, Beirut, Lebanon.
World Bank. “Mounting Burdens on a Crisis-Ridden Country”, 2024, Washington DC.
World Bank. “Poverty and Equity Assessment”, 2024, Washington DC.
[1] International Energy Agency. Oil Market Report – March 2026. Avaiable on: https://www.iea.org/reports/oil-market-report-march-2026
[2] Keynote Speech by IMF Managing Director Kristalina Georgieva at Japan's Ministry of Finance's "Future of the Global Economy amid a Fluid International Economic and Monetary Order" Symposium in Tokyo, Japan, 9 March 2026.
https://www.imf.org/en/news/articles/2026/03/09/sp030926-coping-and-thri...
[4] More here: https://www.moph.gov.lb/en/Pages/127/84174/#/en/Pages/127/84385/updated-total-toll-of-the-aggression-2727-martyrs-and-8438-wounded
[5] The fourth and the last Arab-Israeli war that left Lebanon as the only open front with Israel.
[6] Harvey, David. A brief history of neoliberalism. Oxford university press, 2007.
[7] Binder, Carola, and Rupal Kamdar. 2022. "Expected and Realized Inflation in Historical Perspective." Journal of Economic Perspectives 36 (3): 131–56.
[8] ECB, Economic Bulletin, Issue 2 / 2026 – Economic, financial and monetary developments Overview, March 2026.
[9] Keynote speech by Christine Lagarde, President of the ECB, at “The ECB and Its Watchers” conference organised by the Institute for Monetary and Financial Stability at Goethe University Frankfurt, 25 March 2026, https://www.ecb.europa.eu/press/key/date/2026/html/ecb.sp260325~ac2916a2...
[11] Hariri, Nizar. “When the World Bank Assesses the War in Ukraine and the Conflicts in Palestine and Lebanon”, CeSSRA, 2025.
[13] World Bank, Lebanon sinking (to the top 3), 2021.
[14] World Bank, 2024, Mounting Burdens on a Crisis-Ridden Country.
[15] Jamali, Ibrahim. 2022. “Lebanon’s Economic Crisis: A Stabilization Plan and an IMF Program Report on the Second Webinar Series”, Issam Fares Institute, American University of Beirut.
[16] Hariri, Nizar. 2023. “Unprotected. Survey Report on The Challenges of The Current Social Protection System in Lebanon Amidst The Crisis.” The Centre for Social Sciences Research and Action (CeSSRA)the majority of their income in this period.
[17] WB. 2024. “Poverty and Equity Assessment”, Washington DC.
[18] World Bank, 2024, Mounting Burdens on a Crisis-Ridden Country, p. 3
[19] Read more: https://news.un.org/en/story/2026/03/1167181