Mapping of Political Violence in Lebanon (1975 - 2008)
Publication Date: 2014
Mapping of Political Violence in Lebanon (1975 - 2008) is a project by Lebanon Support in partnership with the International Center for Transitional Justice (ICTJ) and Friedrich Ebert Stiftung (FES) in Lebanon. The objective of the project is to gather incidents of political violence and human rights violations that occurred in Lebanon between 1975 and 2008 all in one interactive mapping. Mapped incidents include mass killings, bombardments of residential areas, systematic and widespread use of torture, assassinations, arbitrary detention, enforced disappearances, sieges of villages, and deprivation of civilian populations of food and water. The project also includes six interactive timelines, having geographically-specific records, of different periods that saw an escalation of violence. Information sources: The project reproduces the data of the report produced in September 2013 by ICTJ titled “Lebanon’s Legacy of Political Violence: A Mapping of Serious Violations of Human Rights and Humanitarian Law in Lebanon, 1975-2008”.
Legend

Individual incident marker
Individual incidents of conflict are marked at their location. Some incidents occur over a number of days and may have a prolonged time frame. This is especially relevant for armed conflict, and collective actions such as strikes.

Click on the individual marker to see a pop-up box giving a brief summary of the incident, with its categorisation and classification. For a longer description of the incident, click on the incident’s title at the top of the description box.
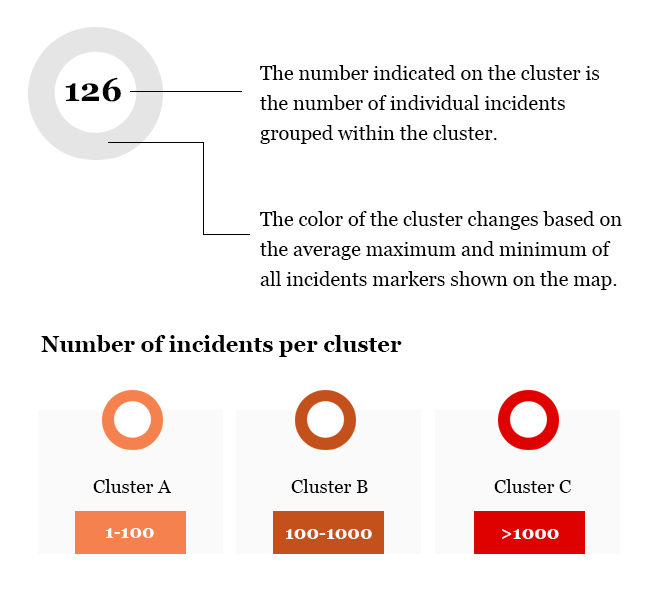
Clustering
A cluster is a grouping of incident markers. Cluster marker colors indicate the number of incidents grouped within that cluster.
Clustering works by dividing the map into a square grid and grouping the markers into their respective squares. The size of a square in the grid changes at different zoom levels.
To see the different incidents grouped within a cluster, click on the cluster, the map will then zoom in to the different incidents grouped within it..